78 - Word Embedding Visualization
Visualizing Word Embeddings is often done to inspect the embedding and experience the cohesiveness of a subset of the embedding.
Visualizing Word Embeddings is often done to inspect the embedding and experience the cohesiveness of a subset of the embedding. It is all about dimension reduction; how to get a 2-D chart from e.g. a 300 dimensional embedding. Three often seen dimension reduction techniques:
- T-SNE (t-Distributed Stochastic Neighbor Embedding) maps the multi-dimensional data to a lower dimensional space. This is computationally expensive. After this process, the input features are no longer identifiable, and you cannot make any inference based only on the output of t-SNE. Hence it is mainly a data exploration and visualization technique. T-SNE is good at preserving local context (neighbors).
- PCA (Principal Component Analysis) is a linear feature extraction technique. It combines your input features in a specific way that you can drop the least important feature while still retaining the most valuable parts of all of the features. As an added benefit, each of the new features or components created after PCA are all independent of one another.
- UMAP (Uniform Manifold Approximation and Projection) has some advantages over t-SNE, most important is the increased speed and better preservation of the data’s local (neighbors) and global (clusters) structure.
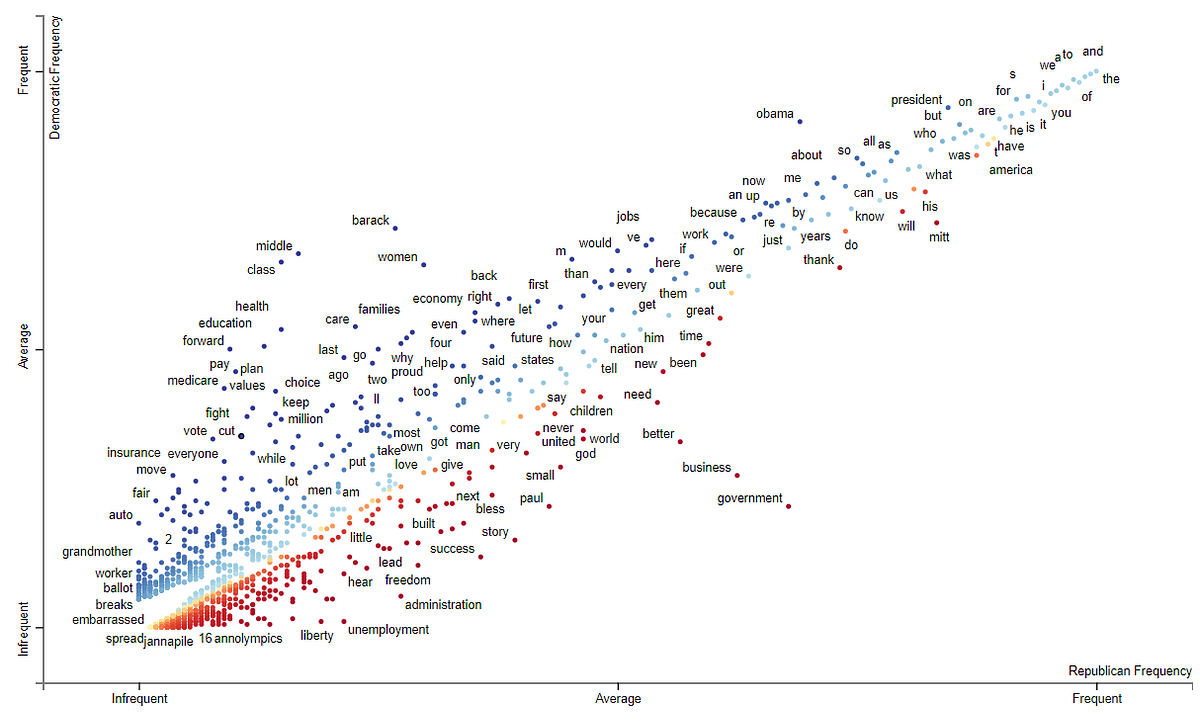
Scattertext is a famous package for finding distinguishing terms in corpora, and presenting them in an interactive, HTML scatter plot. This is done by visualizing the difference and overlap of two categories of documents. You can try a demo about republican vs democratic speeches.
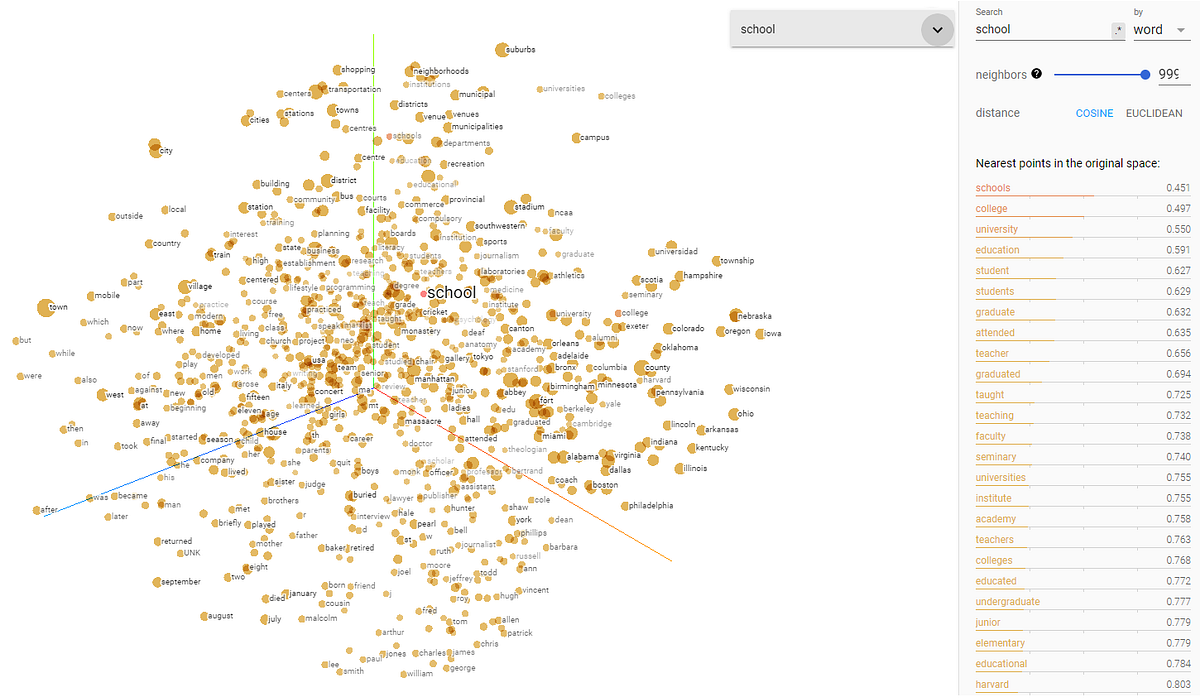
Googles TensorBoard Embedding Projector graphically represents high dimensional embeddings. This can be helpful in visualizing, examining, and understanding your embedding layers. A similar but simpler library is RASA’s Whatlies that also helps to inspect your word embedding.
This article is part of the project Periodic Table of NLP Tasks. Click to read more about the making of the Periodic Table and the project to systemize NLP tasks.