81 - Knowledge Graph Visualization
Visualizing a network of interlinked descriptions of entities.
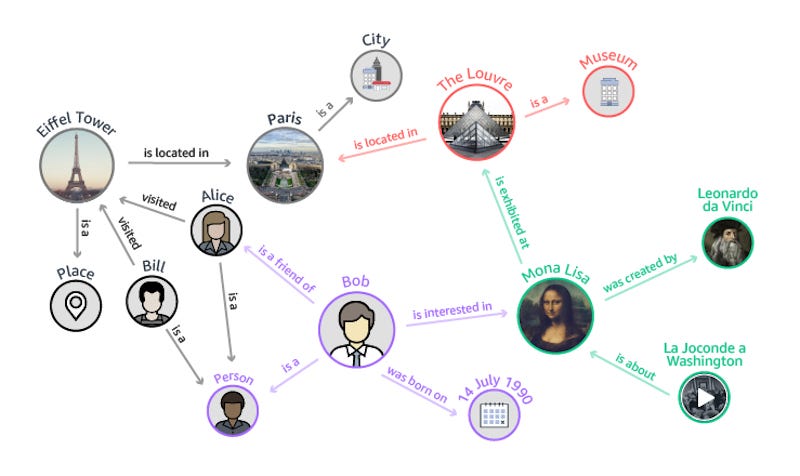
A Knowledge Graph is a knowledge base with interlinked descriptions of entities. This can be used to put data into context and enhance search engines. Keywords and Named Entity Recognition in combination with relation extraction is a good source when feeding Knowledge Graphs.
Technically, a Knowledge Graph is a network that represents multiple types of entities (nodes) and relations (edges) in the same graph. Each link of the network represents an (entity, relation, value) triplet. For example: Eiffel Tower (entity) is located in (relation) in Paris (value). When you know A relates to B and B relates to C, then you automatically profit from the advantage that there is an indirect connection between A and C.
You can build your own network in python with Networkx and draw it with pyplot from Matplotlib. If data gets bigger, you need to scale up to a Graph Database like Grakn, ArangoDB or Neo4j.
Fraud Detection and Exploratory Data Analysis are important use-cases. For example, graph databases were intensively used to explore complex networked data during the Panama Papers investigation.
This article is part of the project Periodic Table of NLP Tasks. Click to read more about the making of the Periodic Table and the project to systemize NLP tasks.